Insights

The Complex Income Desk

Short reads on how lenders assess company directors and the self employed, and what can change the answer.
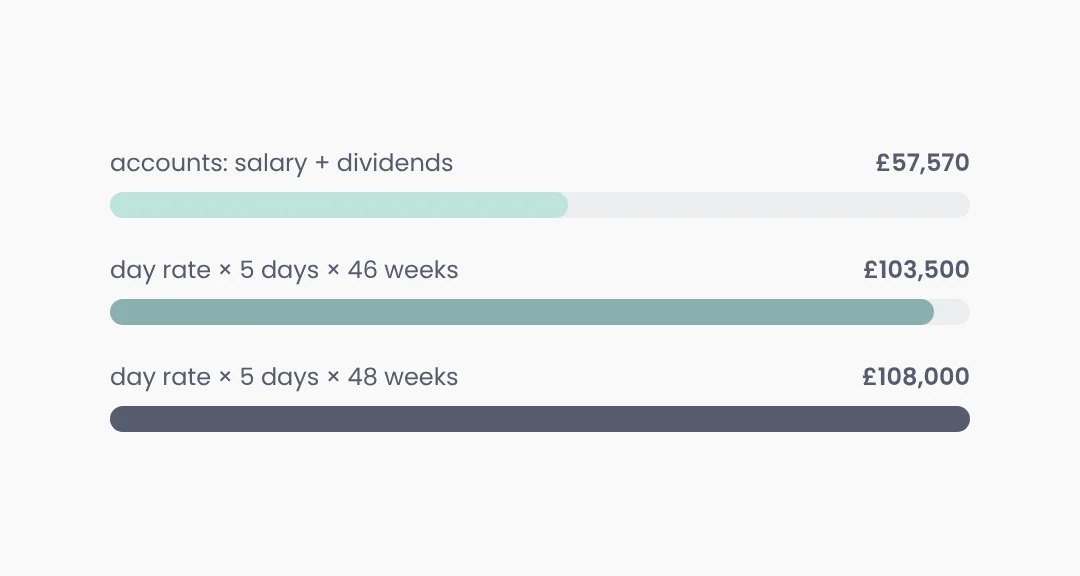
Bar chart: the same contractor's income read two ways, on accounts and on an annualised day rate.
Nov 2026 · 4 min read

Contractor mortgages: day rate vs accounts based lending

Two ways UK lenders work out a contractor's income, side by side, and who each one tends to suit.

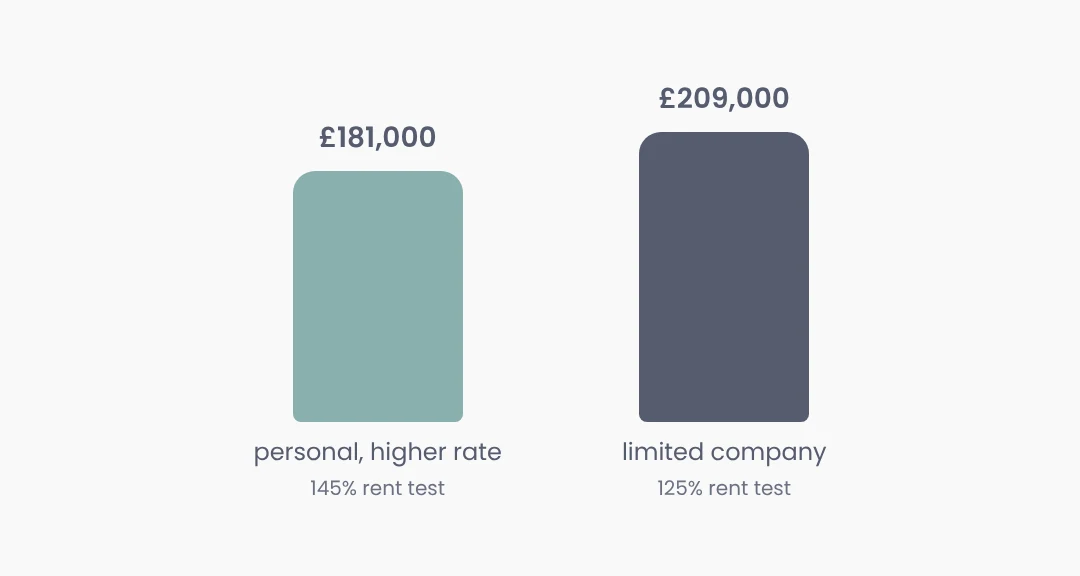
Bar chart: illustrative maximum loan on the same rent under a 125% and a 145% rent test.
Nov 2026 · 4 min read

Limited company vs personal name buy to let: what lenders look at

The mortgage side of buying in a company or in your own name: rent tests, guarantees, rates and paperwork. Tax is a question for your accountant.

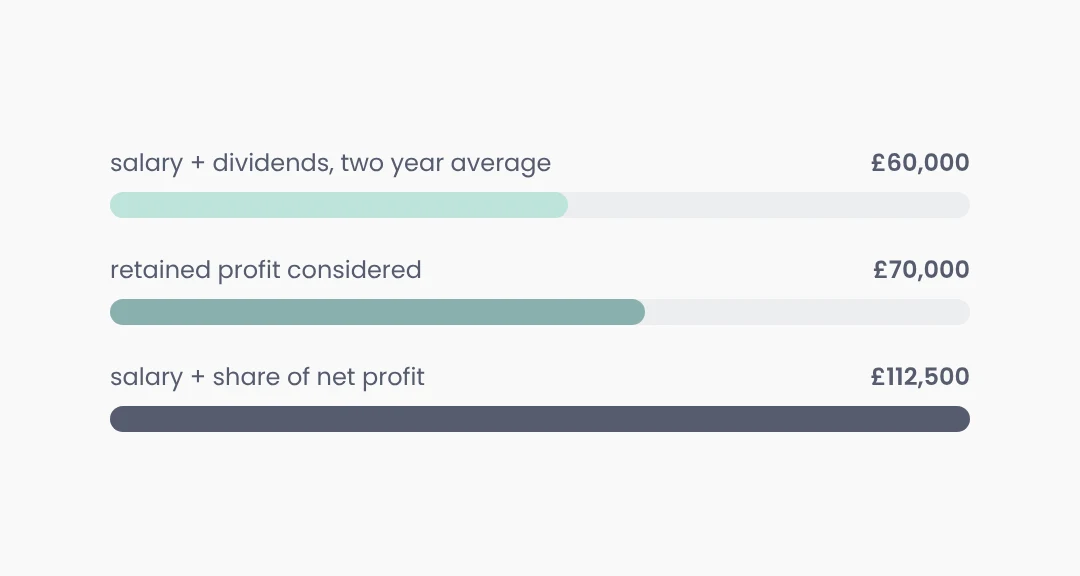
Bar chart: one director's income read three ways, from salary and dividends averaged over two years to salary plus share of net profit.
Nov 2026 · 4 min read

Salary and dividends vs net profit: how UK lenders assess company directors

The three main ways lenders read a director's income, side by side with illustrative figures, and why the method can matter more than the rate.

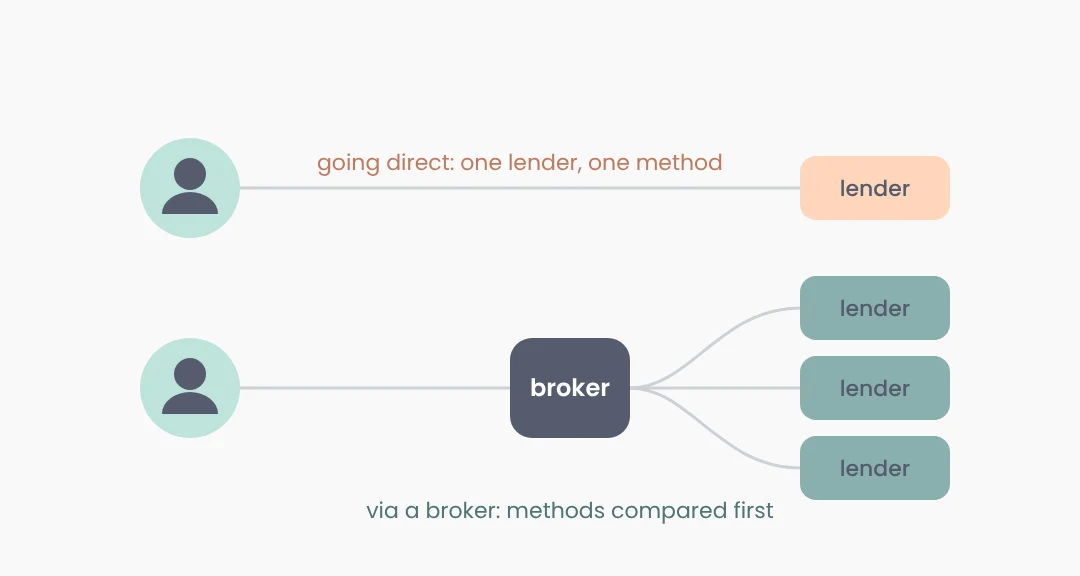
Diagram: one route goes straight to a single lender, the other passes through a broker to several lenders.
Nov 2026 · 4 min read

Using a specialist broker vs going direct as a company director

A balanced look at when a company director benefits from a specialist mortgage broker, and when going direct to a lender is fine.

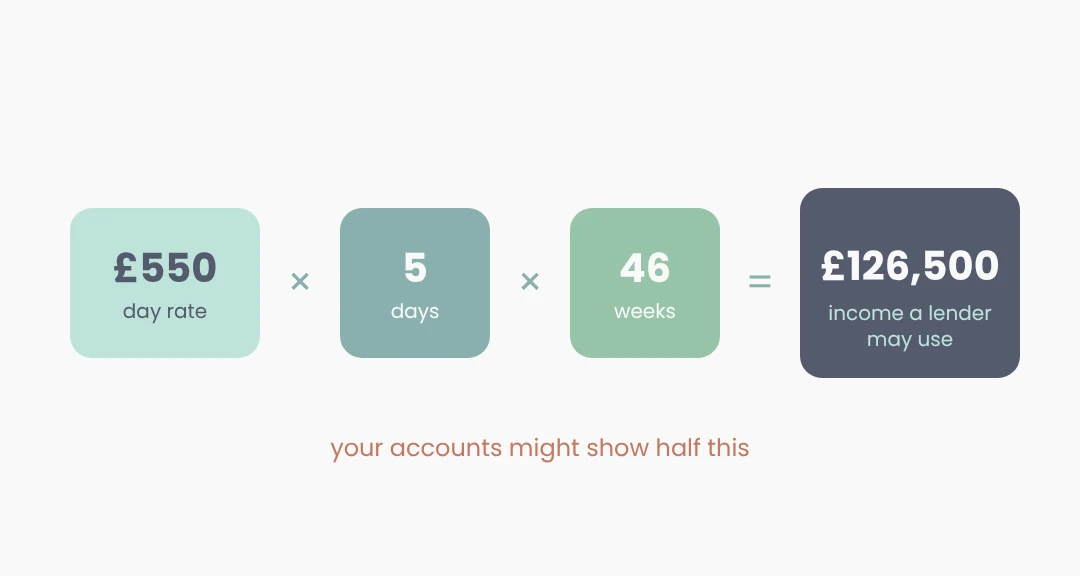
Illustration: a £550 day rate times 5 days times 46 weeks equals £126,500, income a lender may use, while your accounts might show half this.
Updated Nov 2026 · 3 min read

Contractor mortgages: how lenders turn a day rate into income

Why your accounts might not be the figure that matters.

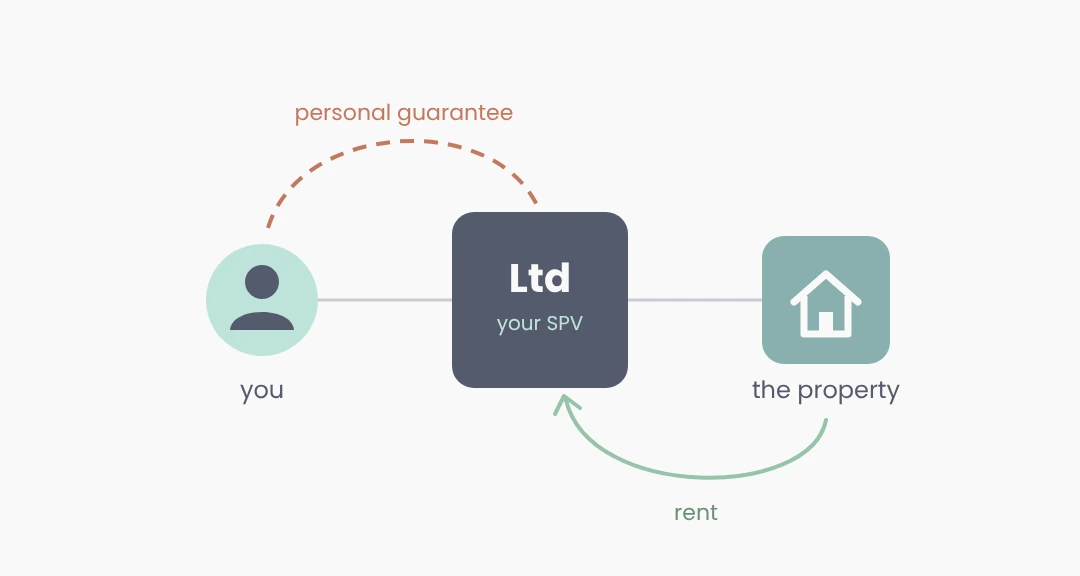
Diagram: you stand behind your limited company with a personal guarantee, the company owns the property, and the rent flows back to the company.
Oct 2026 · 4 min read

Buying property through a limited company: SPV mortgages explained

What changes on the mortgage when the company owns the property.

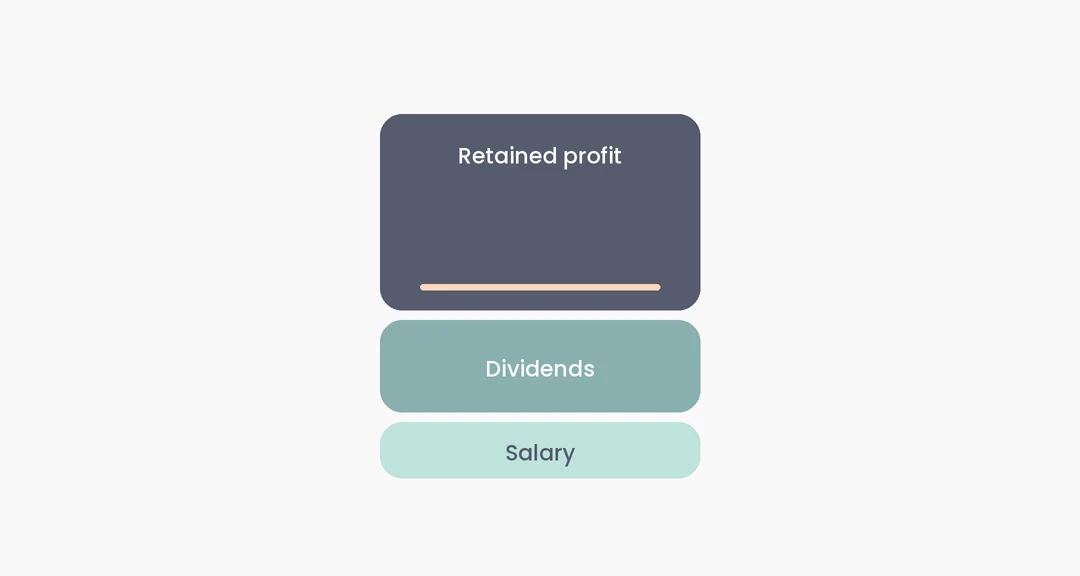
Illustration: salary, dividends and a much larger block of retained profit stacked as layers of one income.
Oct 2026 · 3 min read

Beyond the SA302: how some lenders read the whole business

What a fuller reading of a director’s income can look like.

Chart: a small block for what you drew beside a much taller block for what the group kept.
Oct 2026 · 3 min read

The income your lender never sees

Why salary and dividends tell only part of a director’s story.

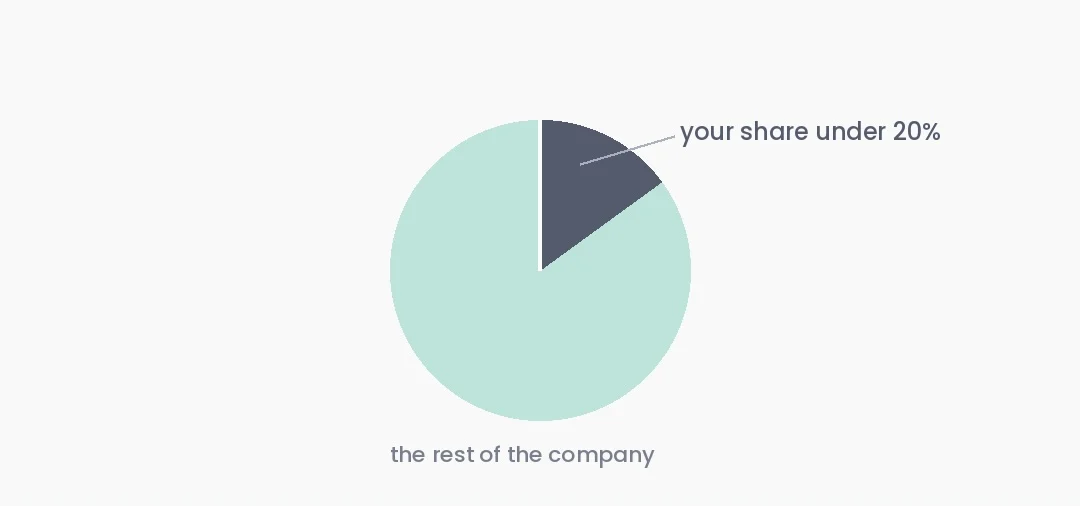
Pie chart: a shareholding under 20% shown against the rest of the company.
Updated Nov 2026 · 3 min read

Own under 20% of your company? Some lenders stop counting your dividends

Why a minority shareholding can quietly shrink your mortgage, and which lenders still count your dividends.

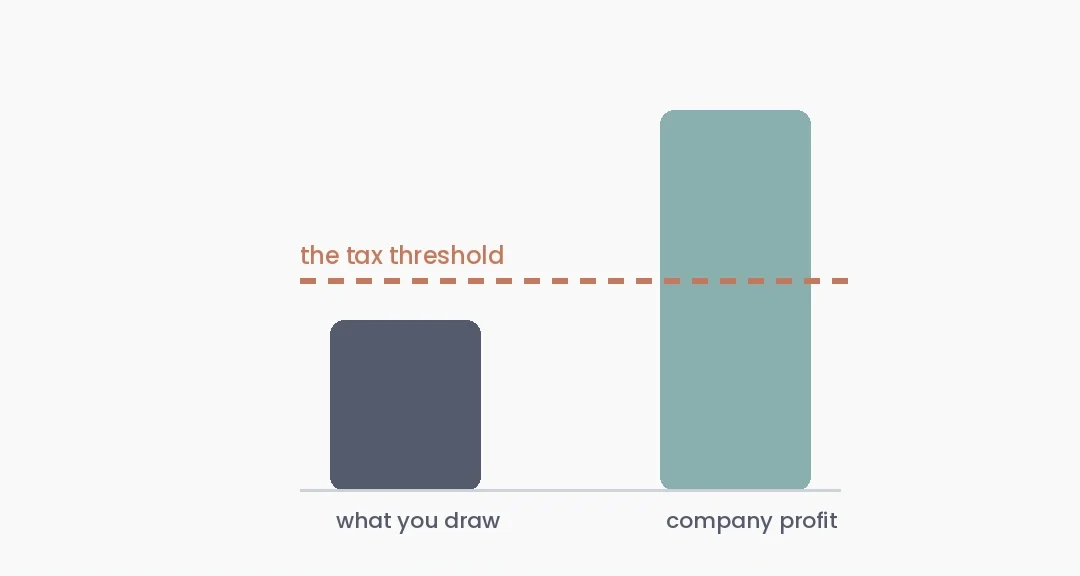
Bar chart: what you draw sits below the tax threshold, while company profit rises well above it.
Updated Oct 2026 · 5 min read

The income tax trap that shrinks your mortgage

Why keeping your income low can quietly cap your borrowing.

Illustration: income from four separate companies flowing into one home.
Updated Nov 2026 · 3 min read

When your income lives in four companies, not one payslip

Why the high street sees a fraction of what you really earn, and how some lenders look across every company.

Bar chart: four years of rising profit, with the lender’s averaged figure drawn well below the latest year.
Updated Oct 2026 · 5 min read

Your best year yet, averaged away by the lender

Why growing businesses get short changed on borrowing.